Productionising Generative AI with MLflow 3.x: Tracing, Evaluation, and Prompt Optimisation
- #mlflow
- #generative ai
- ##llmops
- #RAG
- #observability
- #mlops
- #AI
- #Artificial Intelligence
- #Python
- #Devops
- #llm
- #Machine Learning
- #ai agents
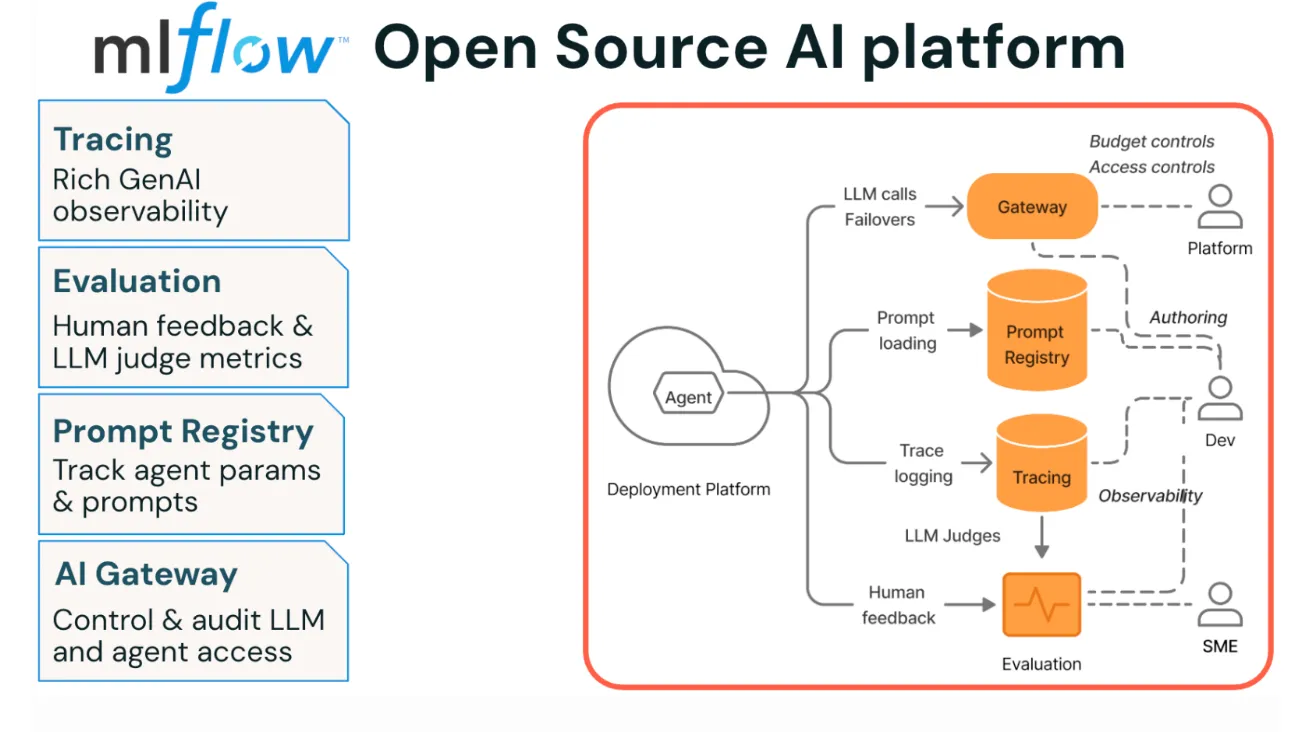
Generative AI systems fail differently from traditional software.
In a normal HTTP service, a production incident often reduces to familiar questions: did the request time out, did the database return an error, did a dependency respond with a 500, or did a new release change the behaviour?
With a retrieval-augmented generation (RAG) application or an agentic workflow, the failure surface is wider. The final response can be well-formed and still be wrong. A vector search might retrieve irrelevant context. A tool call might happen in the wrong order. An agent might loop through the same reasoning step three times, inflate latency and cost, then return a confident answer that was never grounded in the retrieved documents.
That is why production GenAI needs more than API logs. It needs visibility into the execution path, plus an evaluation harness that can score both the final output and the intermediate behaviour that produced it.
MLflow 3.x is interesting because it puts those pieces in one workflow: OpenTelemetry-compatible tracing, LLM-as-a-judge evaluation, custom trace-aware scorers, prompt versioning, and production sampling. This post walks through the architecture I would use to move a GenAI application from a demo into something that can be debugged, evaluated, and improved over time.
Why flat logs are not enough for agents
A RAG or agentic request is not one operation. It is a graph of operations:
- Receive the user question.
- Retrieve context from a vector database.
- Build the prompt.
- Call a chat model.
- Maybe call tools.
- Maybe call the model again.
- Return the final response.
Traditional logging can tell you that the request took six seconds. It rarely tells you whether the vector store took five of those seconds, whether the LLM call was expensive because the prompt carried too much context, or whether the agent wasted time calling a tool it did not need.
MLflow Tracing models the request as a hierarchy of spans inside a trace. The trace is the full execution. Each span is a meaningful unit of work: a retriever call, a tool call, a model call, a formatting step, or the root agent operation.
This matters because quality issues are often created before the final LLM call. If the retrieved context is bad, the response can be bad even when the model behaves exactly as instructed. If a tool call fails silently, the model might fill in the missing information. If the agent loops unnecessarily, the final answer might be correct but too slow and expensive to serve.
OpenTelemetry as the observability contract
MLflow Tracing is compatible with OpenTelemetry and supports GenAI semantic conventions. In practice, that means trace data is not trapped inside one proprietary UI. MLflow can ingest OpenTelemetry traces through an OTLP endpoint such as /v1/traces, and traces generated by MLflow can be exported to OpenTelemetry-compatible platforms.
That is important in real deployments. Your GenAI app might be Python, while a gateway or retrieval service is written in Go, Java, or Rust. Your organisation may already use Datadog, Grafana, Prometheus, or another observability stack. OpenTelemetry gives the platform team a common protocol, while MLflow adds the GenAI-specific metadata needed by ML engineers: prompts, model names, token usage, retriever outputs, tool inputs, and evaluation feedback.
The core idea is simple: treat traces as the shared debugging substrate, not as a notebook-only artefact.
Span types give the trace semantic meaning
The shape of the trace matters, but the meaning of each span matters just as much. MLflow supports span types such as:
| Span type | What it represents | Why it matters |
|---|---|---|
AGENT | An autonomous agent or top-level orchestration step | Useful for grouping the full decision path |
CHAIN | A sequence of coordinated sub-steps | Useful for prompt formatting, routing, or pipeline stages |
CHAT_MODEL or LLM spans | A model invocation | Useful for token, latency, and prompt inspection |
TOOL | A function, API, calculator, database call, or external action | Useful for tool correctness and efficiency checks |
RETRIEVER | Context retrieval, usually from a vector database | Required by RAG judges that inspect retrieved documents |
EMBEDDING | Text-to-vector conversion | Useful for retrieval pipeline diagnostics |
RERANKER | Reordering retrieved contexts | Useful when debugging ranking quality |
The RETRIEVER span is especially important. MLflow’s RAG judges expect retriever spans to output documents in a structured shape. Each document should carry page_content and metadata such as doc_uri or chunk_id. Without that structure, an evaluator cannot reliably separate “what the model knew” from “what the model invented.”
A traced RAG agent
The following example shows a small manually instrumented RAG agent. The goal is not to build a full financial assistant. The goal is to show where the observability boundaries should be.
import time
from typing import List

import mlflow
import openai
from mlflow.entities import Document, SpanType

mlflow.openai.autolog()
client = openai.OpenAI()


@mlflow.trace(name="vector_database_query", span_type=SpanType.RETRIEVER)
def retrieve_financial_documents(query: str) -> List[Document]:
    span = mlflow.get_current_active_span()
    span.set_attributes({"search_strategy": "hybrid", "top_k": 2})

    time.sleep(0.3)
    raw_results = [
        {
            "content": "Q3 revenue increased by 14% to $1.2B.",
            "uri": "s3://reports/q3_earnings.pdf",
        },
        {
            "content": "Operating margins expanded after reduced cloud compute costs.",
            "uri": "s3://reports/q3_margins.pdf",
        },
    ]

    documents = [
        Document(page_content=row["content"], metadata={"doc_uri": row["uri"]})
        for row in raw_results
    ]

    span.set_outputs(documents)
    return documents


@mlflow.trace(name="currency_conversion_api", span_type=SpanType.TOOL)
def convert_currency(amount_usd: float, target_currency: str) -> float:
    if target_currency not in {"EUR", "GBP", "JPY"}:
        raise ValueError(f"Unsupported target currency: {target_currency}")

    conversion_rate = 0.92
    return amount_usd * conversion_rate


@mlflow.trace(name="financial_analysis_agent", span_type=SpanType.AGENT)
def financial_agent(user_query: str, target_currency: str = "USD") -> str:
    mlflow.update_current_trace(
        request_preview=user_query,
        tags={"environment": "production", "agent_version": "2.1.0"},
    )

    docs = retrieve_financial_documents(user_query)
    context = "\n\n".join(
        f"Source: {doc.metadata['doc_uri']}\n{doc.page_content}"
        for doc in docs
    )

    with mlflow.start_span(name="prompt_formatting", span_type=SpanType.CHAIN) as span:
        system_prompt = (
            "You are a financial analyst. Answer using only the provided context.\n\n"
            f"Context:\n{context}"
        )
        span.set_inputs({"document_count": len(docs)})
        span.set_outputs({"context_length": len(context)})

    response = client.chat.completions.create(
        model="gpt-4o-mini",
        messages=[
            {"role": "system", "content": system_prompt},
            {"role": "user", "content": user_query},
        ],
        temperature=0.0,
    )

    final_text = response.choices[0].message.content or ""

    if target_currency != "USD":
        try:
            converted = convert_currency(1_200_000_000, target_currency)
            final_text += (
                f"\n\nNote: $1.2B USD is approximately "
                f"{converted:,.2f} {target_currency}."
            )
        except ValueError as exc:
            final_text += f"\n\nNote: currency conversion failed: {exc}"

    mlflow.update_current_trace(response_preview=final_text[:300])
    return final_text
There are a few production-minded details in this shape:
- The retriever returns
Documentobjects, so RAG evaluators can inspect the retrieved context. - The currency conversion function is a
TOOLspan, so its failures and latency are visible separately from the model call. - Prompt construction is a
CHAINspan, which helps isolate bloated prompt templates. - The OpenAI call is captured automatically through
mlflow.openai.autolog(). request_previewandresponse_previewkeep the trace list readable without dumping the full prompt into the overview.
The @mlflow.trace decorator also records exceptions as span events when traced code raises. That gives you a useful failure path: the agent can recover and return a user-safe message, while the failed tool span still shows the real error in the trace.
Concurrency and distributed services
Most production GenAI systems are not single-threaded notebooks. They fan out retrieval calls, run async requests, or cross service boundaries.
MLflow uses Python’s ContextVar mechanism for tracing context. Async tasks inherit context by default, which makes asyncio a good fit for I/O-heavy GenAI workloads. Threads are different: context does not automatically cross thread boundaries. If you use ThreadPoolExecutor, copy the context explicitly with contextvars.copy_context() and run the worker inside that context.
For microservices, MLflow supports distributed tracing through W3C TraceContext headers. The caller injects headers with mlflow.tracing.get_tracing_context_headers_for_http_request(). The receiving service extracts them with mlflow.tracing.set_tracing_context_from_http_request_headers(). Both services need to write to the same tracking server and experiment if you want one connected trace rather than fragmented traces.
This is the difference between “the router called the agent service” and “I can see the router, agent, retriever, and tool call in one execution tree.”
Evaluation starts where tracing ends
Observability answers: what happened?
Evaluation answers: was it good?
For GenAI, lexical metrics such as exact match, BLEU, or ROUGE are often too narrow. A model can paraphrase correctly and fail lexical overlap. It can also produce fluent text that is not grounded in the retrieved context. MLflow’s mlflow.genai.evaluate() harness supports LLM judges, custom scorers, evaluation datasets, traces, and prompt comparison workflows.
An evaluation record usually contains:
inputs: the data passed into the app.outputs: optional precomputed outputs if you are scoring existing responses.expectations: ground truth facts, required behaviour, guidelines, or required tool calls.- traces: either produced during evaluation through
predict_fn, or supplied from historical traffic.
That gives you two useful modes:
- Direct evaluation: run the app over the dataset, generate traces, then score them.
- Answer-sheet or trace evaluation: skip generation and score existing outputs or production traces.
The second mode matters for CI and cost control. You do not always want to rerun expensive model calls just to check whether a new scorer behaves as expected.
RAG judges: separate retrieval from generation
For RAG systems, three questions should be evaluated separately:
| Question | MLflow judge |
|---|---|
| Did we retrieve relevant documents? | RetrievalRelevance |
| Did the retrieved documents contain enough information? | RetrievalSufficiency |
| Did the final answer stay grounded in retrieved information? | RetrievalGroundedness |
This separation is operationally useful. If RetrievalSufficiency fails, the model may never have had the evidence it needed. If RetrievalGroundedness fails while sufficiency passes, the model had the evidence but still invented unsupported claims. Those are different engineering problems.
The important implementation detail is that these judges require traces with at least one RETRIEVER span. The trace is not just observability. It becomes evaluation input.
Add deterministic trace-aware scorers
LLM judges are powerful, but they cost money, add latency, and carry their own uncertainty. For strict business logic, a code-based scorer is usually better.
For example, if a financial agent must query the vector database before answering, do not ask an LLM judge to infer that. Parse the trace and check it directly.
import mlflow
from mlflow.entities import Feedback, SpanType
from mlflow.genai import scorer
from mlflow.genai.scorers import Guidelines, RetrievalGroundedness, RetrievalSufficiency


@scorer
def required_tool_was_called(*, trace, expectations):
    required_tool = (expectations or {}).get("required_tool")
    if not required_tool:
        return Feedback(value=True, rationale="No required tool configured.")

    tool_spans = trace.search_spans(span_type=SpanType.TOOL)
    retriever_spans = trace.search_spans(span_type=SpanType.RETRIEVER)
    called = [span.name for span in [*tool_spans, *retriever_spans]]

    if required_tool in called:
        return Feedback(
            value=True,
            rationale=f"Required tool was called: {required_tool}.",
        )

    return Feedback(
        value=False,
        rationale=f"Expected {required_tool}, but saw {called}.",
    )


eval_data = [
    {
        "inputs": {"user_query": "What changed in Q3 margins?"},
        "expectations": {
            "expected_facts": ["Operating margins expanded", "reduced cloud compute costs"],
            "required_tool": "vector_database_query",
        },
    },
    {
        "inputs": {"user_query": "Convert Q3 revenue to EUR.", "target_currency": "EUR"},
        "expectations": {
            "expected_facts": ["Q3 revenue increased by 14%", "1.2B USD"],
            "required_tool": "currency_conversion_api",
        },
    },
]

results = mlflow.genai.evaluate(
    data=eval_data,
    predict_fn=financial_agent,
    scorers=[
        RetrievalGroundedness(model="openai:/gpt-4o-mini"),
        RetrievalSufficiency(model="openai:/gpt-4o-mini"),
        Guidelines(
            name="professional_tone",
            guidelines="The response must be analytical and avoid conversational filler.",
            model="openai:/gpt-4o-mini",
        ),
        required_tool_was_called,
    ],
)

print(results.metrics)
This is where trace-aware evaluation becomes valuable. You are no longer judging only the answer. You are judging the execution path.
Prompt optimisation should be versioned
Prompt changes should be treated like software changes. If a prompt version improves tone but increases hallucination rate, that is not an improvement.
MLflow’s Prompt Registry lets teams register prompts with mlflow.genai.register_prompt(), load specific versions with mlflow.genai.load_prompt(), and evaluate prompt variants against the same dataset. That creates a clean loop:
- Register prompt version 1.
- Run evaluation.
- Register prompt version 2 with a clear commit message.
- Run the same evaluation dataset.
- Compare the metrics and trace outputs.
The important discipline is to keep the dataset stable while comparing prompt versions. Otherwise you cannot tell whether the prompt improved or the test set changed.
Production configuration
Tracing every request forever is rarely the right production default. You need enough visibility to debug and improve the system, but not so much telemetry that tracing becomes the bottleneck.
MLflow supports asynchronous trace logging and sampling controls:
export MLFLOW_TRACKING_URI="http://your-mlflow-server:5000"
export MLFLOW_EXPERIMENT_NAME="production-genai-app"
export MLFLOW_ASYNC_TRACE_LOGGING_MAX_WORKERS=10
export MLFLOW_ASYNC_TRACE_LOGGING_MAX_QUEUE_SIZE=1000
export MLFLOW_TRACE_SAMPLING_RATIO=0.1
For critical paths, you can override sampling at the traced function:
@mlflow.trace(sampling_ratio_override=1.0)
def payment_or_compliance_agent(request):
    return run_agent(request)
For high-volume paths, lower the sampling rate. For critical financial, compliance, or safety-sensitive paths, trace everything.
MLflow also provides the mlflow-tracing package for production environments where you want the tracing SDK without installing the full MLflow package. That is useful for smaller containers, faster cold starts, and fewer dependency conflicts.
The operating model
The production pattern I would use is:
- Instrument the app so every RAG or agent request creates a meaningful trace.
- Use correct span types, especially
RETRIEVERandTOOL. - Keep retriever outputs structured as documents.
- Build an evaluation dataset with expected facts and required behaviours.
- Combine LLM judges with deterministic trace-aware scorers.
- Version prompts and evaluate each prompt change against the same dataset.
- Use sampling and async logging in production.
- Review human feedback and production traces to expand the evaluation set.
The core shift is this: the trace becomes the unit of GenAI engineering. It is the debugging artefact, the evaluation input, the prompt optimisation record, and the production monitoring signal.
If we only inspect the final answer, we miss the system that created it. MLflow 3.x gives us a way to inspect and score that system directly.
Sources
- MLflow Tracing for LLM and Agent Observability
- OpenTelemetry Integration
- Trace Concepts
- Span Concepts
- Manual Tracing
- Distributed Tracing
- Evaluating LLMs and Agents with MLflow
- RAG Evaluation with Built-in Judges
- Built-in LLM Judges
- Create custom code-based scorers
- Prompt Registry
- Evaluating Prompts
- Production Tracing and Monitoring
- Production Tracing SDK